US Labor Market Data Faces Record-Low Survey Response Rates
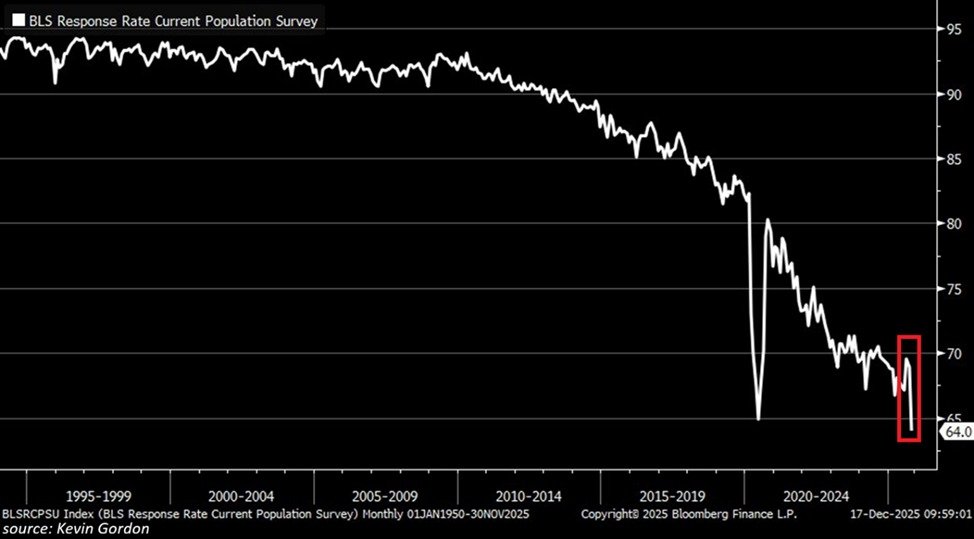
In a development that could reshape the reliability of widely watched labor statistics, the response rate for the Current Population Survey (CPS) has fallen to 64 percent, the lowest on record since the survey’s inception. The CPS, administered in partnership with the U.S. Census Bureau and the Bureau of Labor Statistics, underpins key indicators such as the unemployment rate, labor force participation, and counts of full-time and part-time employment. The latest figures suggest a potential widening gap between the publicly reported metrics and the actual state of the labor market, raising questions about the accuracy of widely used benchmarks that guide policy decisions, business planning, and investor sentiment.
Historical context and the gravity of the change
To understand the magnitude, it helps to look back at the survey’s trajectory. Prior to 2012, CPS response rates consistently exceeded 90 percent, a level that contributed to a sense of confidence in monthly and quarterly labor metrics. Since the onset of the 2020 pandemic, participation in the CPS has declined markedly, but the new 64 percent rate represents a further erosion beyond the pandemic-era dip. Policymakers and economists have long relied on the CPS to paint a detailed portrait of the labor market, including unemployment, labor force participation, and the distribution of jobs by sector and hours worked. When response rates fall, the data must be interpreted with greater caution because smaller, potentially non-representative samples can introduce bias.
Economic implications and measurement challenges
The CPS is used to compute the unemployment rate, the broader unemployment measure, and several other labor indicators that feed into monetary and fiscal policy, wage negotiations, and corporate hiring plans. A lower response rate can increase the margin of error aroundfigures and complicate trend analysis. In practical terms, this could manifest as wider confidence intervals around reported unemployment rates and more volatile month-to-month shifts in labor force participation. Analysts may need to rely more heavily on supplementary data sources, such as establishment surveys, alternative household surveys, or high-frequency indicators, to triangulate the true state of the labor market.
One important dimension is the representativeness of the CPS sample. The survey targets households across the United States and is designed to capture a cross-section of demographics, regions, industries, and employment statuses. When participation declines, certain groups—such as younger workers, temporary migrants, or residents in particular regions—might be underrepresented, potentially skewing estimates of unemployment, joblessness, or hours worked. The challenge for statisticians is to assess and adjust for any differential nonresponse, which requires robust modeling, post-stratification techniques, and transparent communications about the associated uncertainties.
Regional comparisons and potential disparities
Regional labor markets have diverged meaningfully over the last few years, with urban centers often rebounding from pandemic-era lows while some rural areas face persistent labor shortages or structural shifts. A record-low CPS response rate could magnify regional disparities in the reported data if nonresponse biases are not evenly distributed. For example, metropolitan areas with vibrant service sectors might experience different response dynamics than rural counties where employment patterns are more dependent on manufacturing or agriculture. Analysts will be watching for whether the regional breakdowns within CPS data remain consistent with other indicators, such as payroll employment reports, unemployment insurance claims, and consumer confidence measures.
Policy and business responses
Federal and statistical agencies are likely to intensify efforts to assess and mitigate the impact of declining response rates. This could involve methodological reviews, enhanced imputation techniques, or expanded use of auxiliary data to bolster estimates. The broader policy implications hinge on how quickly and convincingly these adjustments can be validated. If the current rate of nonresponse persists, markets could demand greater transparency about the uncertainty surrounding labor metrics, potentially affecting wage negotiations, interest rate expectations, and the timing of policy moves.
Beyond the CPS, diversification of data sources could gain momentum. Establishment surveys, which track payroll employment across businesses, provide a complementary perspective to household surveys like the CPS. The combination of these data streams helps construct a fuller picture of labor dynamics, including the pace of job creation, shifts in industry composition, and trends in hours worked. Private-sector data providers and academic researchers are also likely to explore alternative household surveys and big-data approaches to monitor the labor market with greater resilience to nonresponse.
Historical context informs current interpretation
The CPS’s long-standing role in shaping economic narratives cannot be understated. For decades, policymakers have treated the unemployment rate as a robust barometer of economic health, adjusting fiscal and monetary strategies in response to rising or falling joblessness. A potential upward bias or understated unemployment figure due to nonresponse could complicate the interpretation of inflation dynamics, wage pressures, and slack in the economy. Conversely, if nonresponse affects underemployment or undercounting of part-time workers in a way that inflates the reported unemployment rate, policy responses could become misaligned with the lived experiences of workers who are seeking better opportunities or longer hours.
Public reaction and confidence considerations
Public confidence in official statistics hinges on perceived accuracy and methodological transparency. As nonresponse grows, public discourse often gravitates toward concerns about reliability and the possible manipulation of data for political ends. While there is no indication that the agencies are altering definitions or standards, the legitimacy of the reported numbers depends on open communication about uncertainties and the steps being taken to address them. Economists, journalists, and business leaders will likely scrutinize revisions and methodological notices closely, seeking to understand how the numbers might shift as new data become available.
Implications for labor market narratives
In real-time discussions, the narrative around the labor market often centers on resilience, productivity, and the pace of recovery. A record-low CPS response rate adds a layer of complexity to this narrative. If nonresponse introduces measurable biases, the widely cited unemployment rate could overstate or understate true conditions. That ambiguity has downstream effects on consumer behavior, such as spending decisions, saving patterns, and confidence in the job market. It also influences employer expectations for hiring and compensation, as business leaders weigh the credibility of official indicators against anecdotal experiences from their own operations.
What comes next for statisticians and economists
Looking ahead, the focus will be on validating the CPS estimates with enhanced methodological rigor. This includes improving response modeling, refining weighting schemes, and possibly integrating alternative data sources to keep indicators timely and relevant. The statistical community will likely publish methodological notes detailing how nonresponse is addressed and what levels of uncertainty remain inmeasures. For researchers and policymakers, the key will be to balance the need for timely data with the responsibility to accurately reflect the labor market's condition amid evolving participation patterns.
Regional benchmarks and cross-country comparisons
While the United States grapples with record-low response rates, many other advanced economies rely on different survey designs or administrative data to track labor market trends. Cross-country comparisons can offer valuable context: some nations with robust administrative records may experience more stable data signals, while others with large informal sectors or less comprehensive data infrastructures might face similar nonresponse challenges. Observing how international statistical agencies tackle nonresponse can provide lessons for maintaining data integrity without sacrificing timeliness.
Integrating nonresponse considerations into economic forecasting
Forecasting models that depend on CPS data should incorporate explicit measures of uncertainty tied to response rates. Sensitivity analyses can reveal how robust projections are to potential biases introduced by nonresponse. This approach helps forecasters communicate risk to policymakers, businesses, and the public, reducing the risk of overconfidence in single-point estimates. In an environment where data reliability is under heightened scrutiny, transparent modeling and clear communication of assumptions become critical to maintaining trust in economic forecasts.
Conclusion: A moment for methodological clarity and resilience
The record-low CPS response rate underscores a pivotal moment for economic measurement. While the unemployment rate and related indicators have long guided policymaking and market expectations, rising nonresponse highlights the necessity for methodological resilience, cross-verification with supplementary data, and transparent reporting of uncertainties. The path forward for statisticians involves strengthening estimation techniques, expanding data sources where feasible, and maintaining the rigorous standards that support the credibility of labor market statistics. In the end, the goal remains the same: to provide accurate, timely, and actionable insight into the state of work for millions of Americans, even as the data landscape evolves.