Consumer Inflation Hits Hardest: A Decade-End Look at Shifting Prices and Growing Strain
In the months since late 2019, inflation has reshaped household budgets across the United States, with particular pressure mounting on everyday consumer categories. New data compiled through mid-December 2025 show that a broad spectrum of essential goods and services have surged in price, eclipsing therate in many sectors and reordering the cost of living for millions of Americans. The pattern reflects a complex mix of supply chain dynamics, energy markets, labor costs, and shifting consumer demand, all unfolding against a backdrop of broad macroeconomic strain.
Historical context: inflation’s long arc and this decade’s particular pressures The current inflation narrative did not emerge in isolation. After a relatively stable period in the 2010s, several shocks converged in the late 2010s and early 2020s: global supply chain disruptions, energy price volatility, and a rapid rebound in demand as the economy recovered from a severe downturn. Over time, those forces crystallized into a persistent upward drift in prices for both durable and nondurable goods, as well as many services. While the overall inflation rate for all items has hovered at elevated levels, the variegated experience across categories reveals where price pressures have been most acute and where households have had to reallocate spending.
Economic impact: translating price moves into household budgets and regional outcomes
- Household budgets: With inflation spanning core necessities—such as housing, transportation, food, and energy—families face a difficult balancing act. For households with fixed or slower-growing incomes, even modest monthly price increases accumulate into substantial annual expenditures, prompting adjustments like delaying major purchases, cutting discretionary spending, or shifting to cheaper substitutes.
- Housing and shelter: The rent of primary residence has risen significantly, signaling ongoing tightness in rental markets in many metros. Higher rents not only affect monthly cash flow but also influence long-term decisions about mobility, homeownership, and neighborhood choice.
- Transportation and mobility: Motor vehicle insurance, maintenance, and the price of both new and used vehicles have moved upward at a notable pace. For families relying on personal vehicles for commuting or errands, higher costs here compound other transportation expenses, with ripple effects in insurance markets, financing conditions, and resale value expectations.
- Food and daily essentials: Food away from home and staples such as meat, poultry, fish, bread, and milk have all posted meaningful increases. These shifts alter dietary planning, grocery budgeting, and can influence broader consumer sentiment about cost-of-living adequacy.
- Utilities and energy: Changes in utility gas service and electricity prices reflect ongoing energy market recalibrations and the costs associated with energy transitions, infrastructure upgrades, and regional demand fluctuations. These categories often interact with weather patterns, further influencing monthly bills in different regions.
Regional comparisons: where the pressure is most acute and where resilience appears
- Coastal versus inland markets: Coastal regions with high housing costs and dense population clusters often experience amplified rent and service price pressures. Inland markets, while sometimes more affordable, are not immune; they can be impacted by changes in energy costs, transportation logistics, and commodity prices that travel through supply chains.
- Energy-rich regions: Local energy dynamics, including wholesale gas and electricity prices, can drive more pronounced utility bills, although demographic and labor market differences can modulate the overall impact on households.
- Urban versus rural: Urban centers with higher living costs and more service-based economies typically show stronger price movements in categories such as rent and services, while rural areas may experience different inflation pressures, including transportation costs and food prices, that reflect supply chain routes and local market structures.
Industry-specific drivers: what’s behind the price moves in these categories
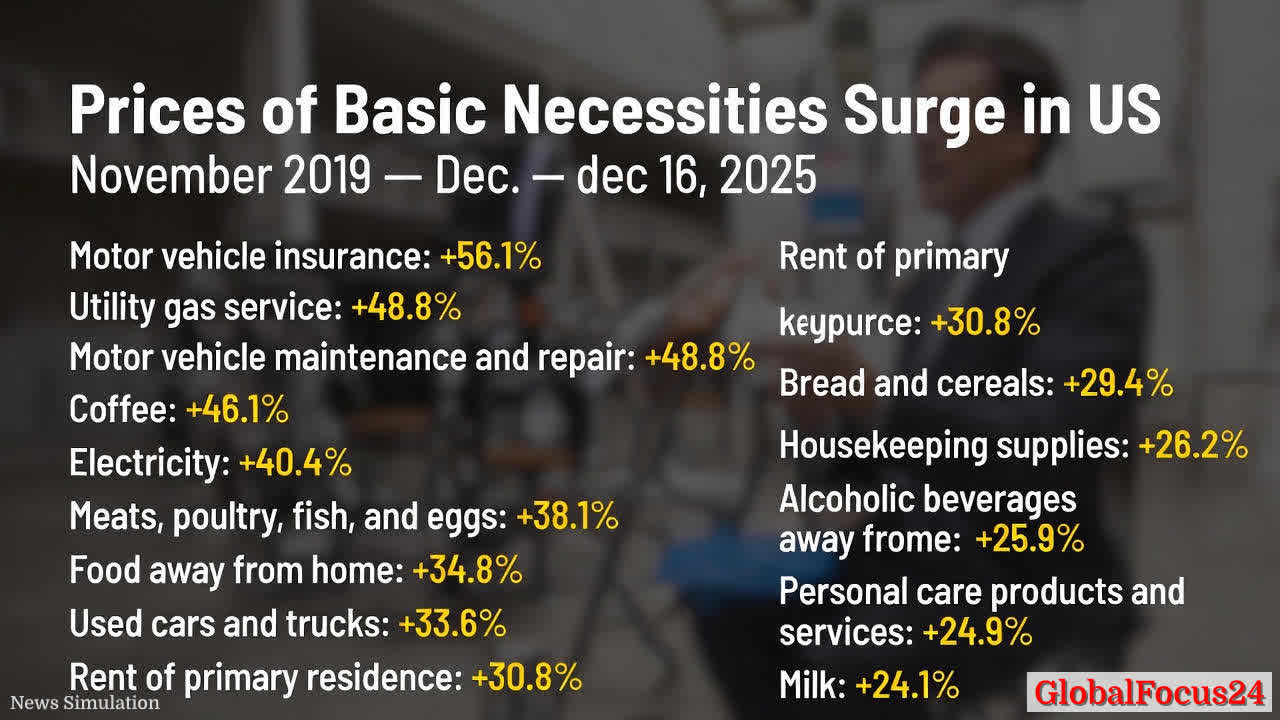
- Insurance and services: Insurance pricing often reflects broader risk pools, regulatory environments, and claims experiences. A 56.1% increase in motor vehicle insurance since late 2019 underscores the sensitivity of noncatastrophic risk pricing to evolving factors such as accident rates, medical costs, and regulatory reforms.
- Energy and utilities: The 40.4% rise in electricity costs and 48.8% growth in piped gas service signal sustained pressure from energy markets, infrastructure investments, and policy environments aimed at modernizing grids and promoting energy security. Weather variability and regional resource mixes further complicate price trajectories.
- Durable and semi-durable goods: The used car market’s 33.6% climb, alongside new car price movements, reflects mix-shift dynamics, supply chain constraints, and the broader automotive sector’s recovery trajectory following manufacturing interruptions.
- Staples and everyday goods: Increases in bread, milk, coffee, and housekeeping supplies illustrate how even routine items can absorb several layers of cost pressures—from agricultural inputs and processing to transport and retail margins.
Public reaction and behavioral responses: adapting to a higher-cost environment
- Budget recalibration: Many households have restructured budgets to accommodate persistent inflation, prioritizing essential goods and services while trimming non-essential or discretionary spending.
- Substitution effects: Consumers often shift toward lower-cost alternatives, store-brand products, or bulk purchasing patterns to stretch limited dollars, influencing retail competition and category dynamics.
- Regional mobility: Some families adjust by relocating to areas with more favorable cost-of-living conditions or stronger job markets, a trend that can have lasting effects on regional demographics and real estate demand.
- Savings and debt: Elevated price levels can reduce disposable income and erode savings rates, while some households manage higher outlays by adjusting credit usage, refinancing, or seeking income growth opportunities.
Forward-looking considerations: what to watch in the inflation landscape
- Policy and macroeconomic signals: Central bank policy, fiscal stance, and consumer confidence will continue to influence inflation dynamics. Market participants will monitor inflation expectations and the pace at which price pressures abate in core categories.
- Supply chain resilience: Ongoing investments in logistics, manufacturing diversification, and domestic production capacity can mitigate some volatility in essential goods prices and help stabilize consumer costs over the longer term.
- Energy transition effects: As energy systems evolve, price movements in utilities and fossil fuel markets will interact with weather, regulation, and technology adoption, shaping household bills and industrial costs across regions.
Conclusion: a decade-defined inflation story with lasting implications The inflation narrative of 2019 through 2025 is not a single thread but a tapestry of interwoven forces that have reshaped what many Americans pay for daily life. From the price of a gallon of electricity to the cost of a loaf of bread and the monthly rent that families rely on, inflation has altered spending patterns, risk perceptions, and regional economic vitality. While some categories have experienced sharper spikes than others, the cumulative effect is unmistakable: a higher cost of living that tests household resilience, prompts strategic adjustments by businesses, and frames policy debates about growth, stability, and opportunity in a changing economy. As policymakers, businesses, and households navigate this landscape, the focus remains on sustaining affordability, promoting productive investment, and ensuring that essential goods and services remain accessible to all segments of the population.