U.S. Producer Price Index March Surprise: February Inflation Upbeat for Prices, Signals Broad Economic Momentum
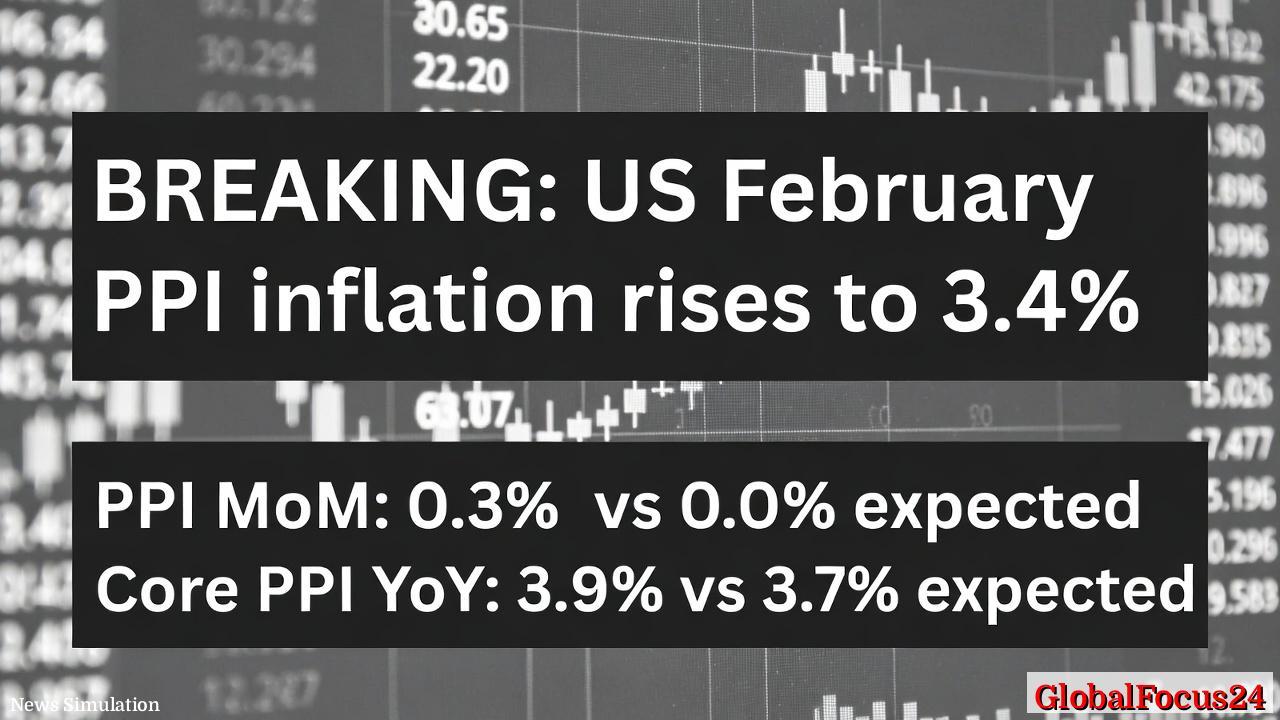
The latest U.S. Producer Price Index (PPI) data released for February shows a firmer inflation picture than many economists anticipated, with bothand core readings signaling enduring price pressures across goods and services suppliers. The PPI rose to 3.4 percent on a year-over-year basis, topping consensus forecasts around 2.9 percent. Excluding food and energy, the core PPI advanced to 3.9 percent, surpassing estimates of 3.7 percent and marking its highest level since February 2023. These figures come amid a complex backdrop of resilient demand, evolving supply chains, and evolving monetary policy expectations, providing critical context for policymakers, businesses, and investors navigating the current economic landscape.
Historical Context: Inflation Trends and the PPI’s Place in the Economy
The Producer Price Index tracks changes in the prices received by domestic producers for goods and services, offering a forward-looking lens on consumer prices and inflation dynamics. Historically, the PPI can anticipate shifts in consumer price pressures as businesses pass higher costs along the supply chain. The February readings continue a pattern observed over the past year: inflation remains more persistent than desired, even as indicators in other sectors have shown episodic cooling.
To place the February numbers in perspective, the PPI’s year-over-year pace has fluctuated with global demand cycles, energy prices, and domestic labor markets. Whileinflation has moderated from the more elevated levels seen during the pandemic recovery, producer prices have endured, reflecting broad-based cost pressures—from raw materials and intermediate goods to services tied to logistics, utilities, and manufacturing inputs. The persistent core PPI—excluding food and energy—signals that price pressures are not solely tied to volatile commodities but also to underlying factors such as wages, supplier capacity constraints, and productivity dynamics across industries.
Economic Implications: What Stronger PPI Means for Markets and Policy
- Inflation trajectory and monetary policy: The February core PPI reading of 3.9 percent suggests that underlying inflation pressures remain more resilient than some forecasters anticipated. For policymakers, this adds texture to the debate over the appropriate pace of interest rate adjustments and balance-sheet normalization. Even as consumer inflation cooled in pockets, producers’ input costs appear to be maintaining a floor that could influence consumer prices down the line, depending on the pass-through mechanism and competitive dynamics in various sectors.
- Business planning and pricing strategies: For firms, elevated PPI readings can affect pricing power and margins. Companies with longer production cycles or heavily domestically sourced inputs may face tighter profit margins if pass-through from higher producer costs to final prices is slow or incomplete. Conversely, industries with strong demand or constrained supply can translate higher costs into sharper pricing, protecting margins and signaling resilience in output.
- Labor market and productivity signals: Persistent producer price pressures can intertwine with wage dynamics and labor market tightness. If producers must bid up wages to attract skilled labor or to offset operational inefficiencies, the cycle can reinforce inflationary momentum. Observers will watch for accompanying data on unit labor costs and productivity to gauge whether elevated PPI translates into broader cost pressures or whether productivity gains can offset some inflationary effects.
Regional Comparisons: How the February PPI Stacks Up Across U.S. Regions
Manufacturing and services sectors exhibit uneven price trajectories across states and regions. In the February readings, energy-intensive regions—where commodity prices hold more sway—often show higher producer inflation due to inputs in manufacturing and transportation. Conversely, areas with robust competition and advanced logistics networks may experience more tempered price growth as firms absorb cost increases through efficiency gains and scale.
- Coastal industrial hubs versus inland manufacturing centers: Regions with dense port activity and integrated supply chains may contend with higher input costs tied to shipping and logistics, while inland centers could face different cost pressures, such as energy prices or regional labor costs. The net effect is a mosaic where sectors like durable goods manufacturing, machinery, and petroleum-related industries exhibit variable inflation dynamics depending on local market conditions and production mix.
- Energy price sensitivity: Regions with higher exposure to energy markets tend to reflect broader PPI shifts more strongly. When energy inputs rise, manufacturers that rely on fuel, electricity, or petrochemical feedstocks can experience amplified price pressures, feeding through to intermediate goods and services.
Industry-Level Observations: Sectors Driving February PPI Strength
- Manufacturing and durable goods: Producers in machinery, equipment, and metal products can face elevated input costs—from steel and aluminum to parts and components. In February, signs of price resilience in these areas suggest producers may still be navigating supply chain frictions and demand normalization, which can support pricing power in certain subsectors.
- Transportation and logistics: Transport services and freight-related inputs often move with energy prices and global trade flows. Strength in this arena can lift the PPI, given the essential nature of logistics for manufacturing and distribution networks nationwide.
- Utilities and services: Utilities and related services contribute to the core component of producer prices. As utilities costs react to weather, demand, and regulatory factors, services sectors linked to maintenance, repair, and professional activities can exhibit steadier price growth, reinforcing the core PPI backdrop.
- Food and commodity inputs: While food prices are excluded in the core PPI,readings still capture the broader cost environment. Volatile agricultural markets, commodity price shifts, and weather events can briefly tilt the PPI, though core components provide a more persistent measure of producer-side inflation pressures.
Global Context: International Price Pressures and Trade Implications
Global supply chains remain a key driver of domestic producer prices. As industries rebalance after recent disruptions, international input costs, shipping rates, and exchange rate movements influence the domestic PPI trajectory. Trade partners’ inflation dynamics can spill over, affecting export-oriented sectors and import-dependent manufacturing. In a world where global demand and supply are increasingly interconnected, even modest shifts in overseas inflation or commodity markets can ripple through domestic producer prices, shaping the inflation outlook and policy responses.
Public Reactions and Market Readiness: How Investors and Businesses Interpreted the February PPI
Financial markets and business leaders closely track PPI data for signals about inflation persistence and the trajectory of inflation expectations. A hotter-than-expected core PPI tends to heighten sensitivity to future interest rate movements, prompting traders to reassess bets on the path of policy rates and the timing of asset purchases or reductions. For businesses, the February readings underscore the importance of monitoring supplier contracts, hedging strategies, and inventory management to mitigate risk from continued price volatility.
Historical Comparisons: Positioning February 2026 PPI Within a Longer Timeline
When placed on a multi-year chart, the February 2026 PPI readings sit at a level that underscores the transition from peak pandemic-era distortions to a more normalized inflation regime. The core measure’s ascent to its highest point since early 2023 underscores the degree to which producer margins and supply chain dynamics have evolved. History shows that producer price movements often foreshadow consumer price changes, making February 2026 a data point to watch for any subsequent shifts in retail inflation and overall price stability.
What This Means for Consumers and the Road Ahead
- Price expectations: While consumer prices have shown periods of relief, persistent producer price inflation can foreshadow renewed consumer price pressures if businesses pass higher costs along to shoppers. Households should watch for signs of rising costs in everyday purchases, especially in sectors with strong supplier pricing power and limited competition.
- Policy trajectory: The PPI numbers contribute to the ongoing policy dialogue around inflation targeting and macroeconomic stability. Policymakers weigh a constellation of indicators, including PPI, CPI, labor market data, and growth metrics, to determine the pace and scope of policy normalization or accommodation.
- Investment strategy: Investors assessing fixed income and bargain opportunities across equities may recalibrate expectations for inflation-linked assets and sectors with resilient pricing power. The February PPI data can influence scenarios for rate expectations, yield curves, and sector weights in portfolios.
Regional Outlook: What to Watch Next
Looking ahead, regional price dynamics will likely diverge based on industry mix, energy exposure, and supply chain reconfiguration. Regions with diversified manufacturing bases and strong logistics networks may better absorb input cost shocks, while those heavily reliant on energy-intensive production could experience more pronounced producer price movement. Analysts will monitor updated PPI components to determine where inflationary pressure is broadening versus where it is concentrated in specific sectors.
Key Takeaways
- February PPI rose more than anticipated, withinflation at 3.4 percent and core inflation at 3.9 percent, signaling persistent producer-level cost pressures.
- The core measure’s climb to its highest level since February 2023 highlights underlying inflation dynamics beyond volatile commodities.
- Economic implications span policy considerations, business pricing strategies, wage dynamics, and market expectations, underscoring the interconnected nature of inflation, growth, and monetary policy.
- Regional and industry-specific differences will shape how the February data translates into consumer prices and business outcomes in the months ahead.
- The data underscore the importance of continued vigilance regarding supply chain resilience, productivity gains, and cost-management strategies as the economy adjusts to evolving demand patterns and policy settings.
In a landscape where price signals remain intricate and interconnected, the February PPI figures illuminate a trajectory where inflation could drift persistently higher than initially anticipated, even as other indicators cool. For policymakers, businesses, and households alike, the data emphasize the need for careful navigation through evolving wage pressures, supply chain realignments, and the delicate balance between growth and price stability that defines the next chapter of the economic cycle.