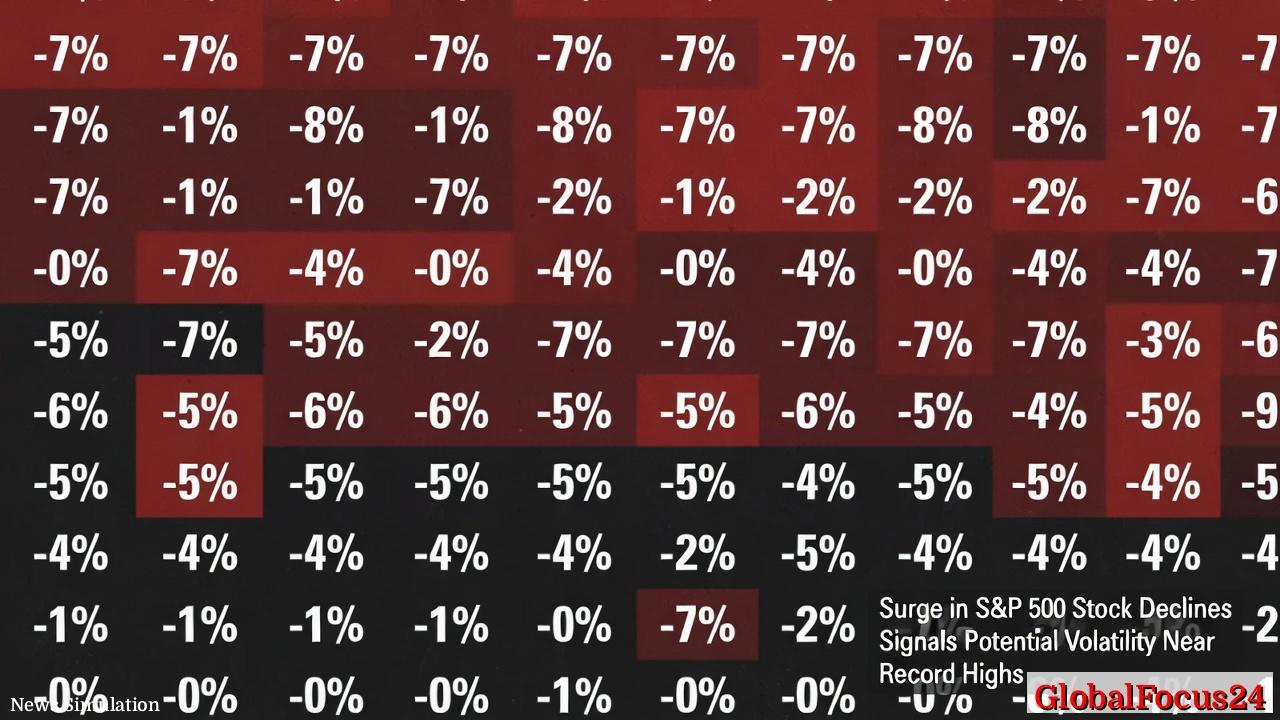
Surge in S&P 500 Stock Declines Signals Potential Volatility Near Record Highs
New York, February 14, 2026 – The S&P 500 index remains within striking distance of record levels, trading just 2% below its all-time high. Yet beneath the surface, turbulence is building. Over the last eight trading sessions, at least 115 of the index’s constituent companies have suffered single-day drops of 7% or more—a rare signal of internal market stress.
The dissonance between the S&P 500’sperformance and the weakness of its underlying components is sparking concern among investors and analysts alike. Historically, such conditions have often preceded steep market corrections. According to data spanning multiple decades, when more than 115 S&P 500 stocks experience 7% or larger daily declines within an eight-day rolling window, the average subsequent drawdown for the index is approximately 34%.
Signs of a Fragile Rally
Despite the outward calm of the benchmark index, analysts describe the recent pattern as one of hidden fragility. “We’re witnessing a tug-of-war between concentrated strength in mega-cap names and pronounced weakness across the broader market,” said one portfolio strategist at a major U.S. asset manager. “That’s not sustainable indefinitely.”
The dynamic has created what some describe as a “bifurcated market.” Few dominant companies—primarily in technology, consumer services, and energy—are carrying the index, while most constituents are lagging. This disproportionate influence has become more pronounced as passive investing and index-tracking funds continue to channel capital toward top-weighted names.
Investors are increasingly alert to the possibility that this narrow leadership could amplify volatility should market momentum begin to wane. If even a handful of leading stocks falter, the index’s outward stability could unravel rapidly.
Historical Context: Echoes of 2000 and 2008
The last time a similar internal divergence occurred while the S&P 500 hovered near record highs was during the climax of the dot-com bubble in 2000. Then, market leaders such as Cisco, Intel, and Microsoft maintained impressive rallies even as hundreds of smaller-cap technology and industrial firms began to break down. Within months, the broader index succumbed to a severe downturn, retracing nearly half its value over the following two years.
By contrast, in 2008’s financial crisis, comparable clusters of steep stock declines only appeared after the S&P 500 had already entered clear bear-market territory. In that instance, the signal reflected systemic stress already well underway across credit markets and banking institutions.
The difference underscores why analysts are paying close attention now: sharp internal weakness emerging while the aggregate index remains buoyant may point to an early phase of stress rather than a late one.
Concentration in Mega-Cap Stocks
Today’s version of market concentration is unprecedented in scale. The top ten companies by market capitalization—led by technology giants, large retailers, and integrated energy producers—now account for over 35% of the entire S&P 500’s weighting.
That dominance means the daily trajectories of a handful of stocks can mask broader market tremors. Even as dozens of companies lose billions in market value, robust performances from these heavyweights can keep the index near its highs.
This concentration effect, while beneficial on the way up, can cut both ways. Should confidence erode around these leaders’ growth prospects or valuations, the impact could ripple rapidly across passive investment vehicles, amplifying sell-offs across sectors.
Structural Shifts in Market Behavior
The pattern also reflects evolving structural dynamics in modern financial markets. Algorithmic trading, high-frequency strategies, and the proliferation of sector ETFs have intensified correlations across groups of stocks. In periods of heightened uncertainty, these automated systems can trigger swift, synchronized sell-offs, deepening volatility and spreading declines even into otherwise stable sectors.
At the same time, long-term fundamentals—corporate earnings, productivity trends, and global liquidity—remain resilient. The U.S. economy continues to show steady expansion, supported by moderating inflation and strong employment data. This backdrop has tempered the likelihood of an immediate systemic shock, though it has not dispelled fears of a correction after a prolonged stretch of gains.
Investor Reactions and Volatility Measures
Volatility metrics offer a mixed picture. The CBOE Volatility Index (VIX), often referred to as Wall Street’s “fear gauge,” rose modestly this week but remains well below levels typical of outright market distress. Options markets, however, have noted an uptick in hedging activity, suggesting institutional traders are quietly bracing for potential disruption.
Retail investor sentiment, meanwhile, has begun to cool. Flows into equity mutual funds and ETFs slowed in recent weeks after months of steady accumulation. Many households, having benefited from strong market performance in 2025, appear to be locking in gains and rotating toward cash or short-duration bonds as a precaution.
Comparative Lessons from Global Markets
The U.S. is not alone in experiencing uneven market breadth. European and Asian benchmarks have recently displayed similar patterns, with flagship indices near peaks even as smaller-cap and cyclical sectors stumble.
In Europe, the STOXX 600’s strong technology and energy components have masked weakness in regional banks and consumer goods firms. In Asia, Japan’s Nikkei 225 maintains elevated levels owing to a handful of export-driven giants, while domestic growth plays have faltered after last year’s rapid gains.
Such parallels hint at a broader shift in global equity dynamics—one increasingly driven by liquidity flows, sector momentum, and valuation polarity rather than uniform economic optimism.
The Economic Backdrop: Growth Balancing Risk
From a macroeconomic standpoint, the U.S. economy continues to expand at a moderate pace. Corporate earnings reports for the fourth quarter of 2025 exceeded expectations in aggregate, though profit margins showed pressure from rising input costs and wage growth.
Interest rate expectations remain a crucial variable. The Federal Reserve’s most recent guidance suggested a continued emphasis on data-dependent decisions, leaving open the possibility of modest rate cuts later in 2026 if inflation maintains its downward trajectory. Lower borrowing costs could offer near-term relief for equity valuations, but persistent uncertainty around geopolitical developments and consumer spending poses a counterweight.
Market Breadth as a Risk Indicator
Market technicians often view breadth indicators—such as the percentage of stocks trading above their 200-day moving average—as crucial early warnings of underlying weakness. In the current environment, that metric has retreated sharply, with less than half of S&P 500 constituents maintaining long-term upward trends.
This divergence implies that theindex performance may not accurately reflect the health of the broader market. Historically, periods of narrowing breadth have preceded either sideways consolidation or outright corrections, particularly when valuations are elevated and investor positioning leans heavily toward growth-oriented sectors.
Looking Ahead: Signals for Traders and Policymakers
As analysts weigh whether the current episode represents a mild rotation or a harbinger of volatility, market participants are emphasizing the importance of liquidity and diversification. Active managers, who struggled to outperform passive benchmarks during the last phase of the rally, now see opportunities to exploit mispricings among cyclical and small-cap names.
Policymakers and regulators are likewise attentive to how concentrated leadership might affect market stability. While the Federal Reserve’s focus remains on inflation and employment, the interplay between monetary policy and asset valuations could gain renewed attention if volatility spikes unexpectedly.
A Balancing Act Between Optimism and Caution
For now, investors face a delicate equilibrium. The S&P 500’s proximity to record highs continues to attract optimism, yet the breadth of recent declines warns of instability beneath the surface. The market’s fate may hinge on whether leading stocks can sustain momentum without broader participation—a challenge that has historically proven difficult during late-stage rallies.
Whether this tension resolves through a soft rebalancing or a sharper correction will depend on corporate earnings resilience, consumer confidence, and the flow of macroeconomic data in the weeks ahead.
As one veteran market observer put it, “The index looks calm, but the floorboards are creaking.” The coming months will reveal whether those creaks mark a passing tremor—or the early rumble of a more significant shift in market direction.