S&P 500 Splits: A Peak of Overbought Momentum and Oversold Pressure Signals Market Tension
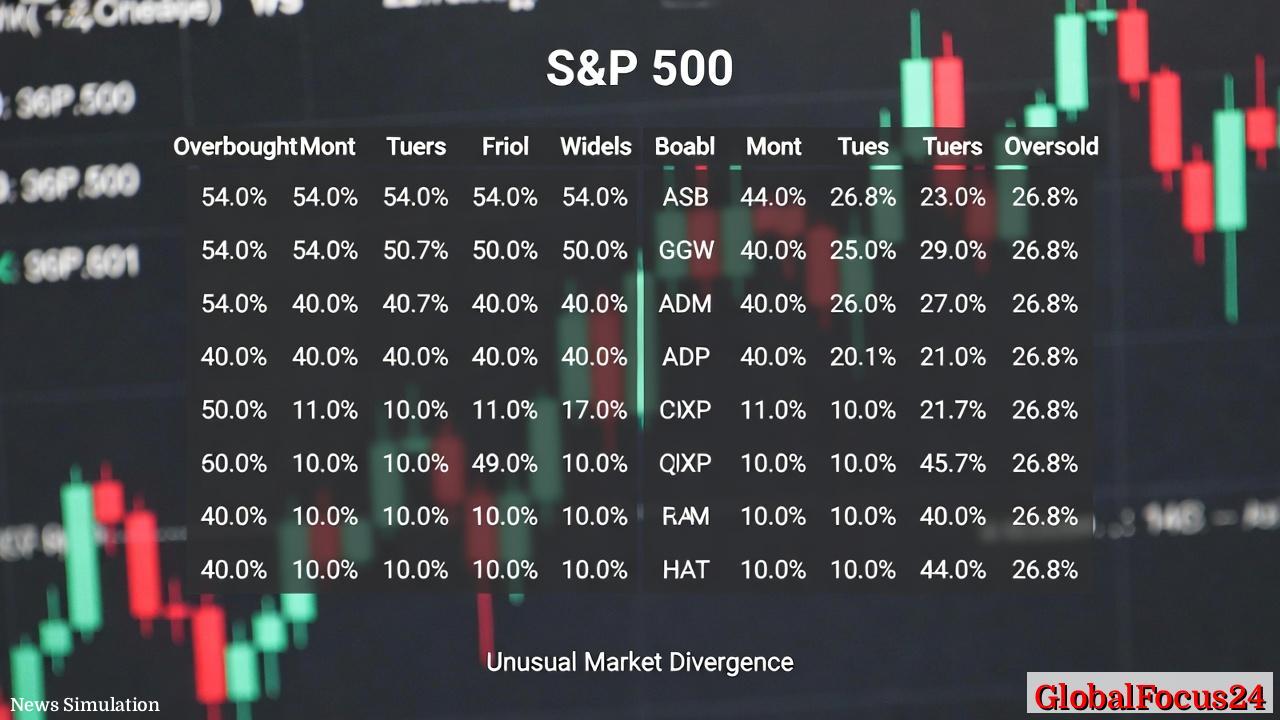
In a striking development for U.S. equities, a broad-based tilt toward both overbought and oversold conditions has emerged among S&P 500 components, signaling a rare confluence of aggressive buying and selling across the index. With 54.0 percent of stocks currently overbought—the highest share since June 2025—and 26.8 percent of stocks oversold—the strongest such reading since October, market analysts are watching for clues about the near-term trajectory of risk appetite and price discovery. This unusual divergence, typically characterized by inverse movement between overbought and oversold metrics, underscores a recalibration in sector leadership, liquidity dynamics, and investor risk tolerance.
Historical context: cycles, catalysts, and the echo of prior divergences To understand the current pattern, it helps to revisit how overbought and oversold conditions have interacted in the past. The S&P 500, a market-cap-weighted barometer of the broad U.S. equity market, often exhibits countervailing pressures as traders rotate between growth and value regimes, macro risk signals, and company-specific news. In typical months, a surge in overbought readings tends to coincide with a retreat in oversold measures as prices climb and more stocks enter momentum-driven territory. Conversely, a spike in oversold stocks often accompanies a cooling market rally or profit-taking, as downward pressure widens breadth concerns.
The present moment, however, reflects a more complex dynamic. The simultaneous expansion of both overbought and oversold populations suggests that a broad swath of names are undergoing rapid, divergent moves—some advancing on renewed optimism or liquidity inflows, others retreating on earnings uncertainty, sector rotations, or idiosyncratic catalysts. This pattern echoes earlier episodes where liquidity shocks or risk-off/risk-on swings produced broad-based discordant breadth readings, often preceding a period of heightened volatility or a shift in leadership from momentum to defensives, or vice versa.
Economic impact: breadth signals and investor behavior Breadth indicators, such as the proportion of overbought and oversold stocks, provide a granular read on market internals beyondindices. When a majority of stocks rise in price, it can reflect constructive earnings momentum, improving macro indicators, or supportive monetary conditions. When a sizable portion simultaneously shows overbought signals, it may indicate speculative froth or a near-term pullback risk if valuations outpace fundamentals. At the same time, an elevated share of oversold stocks can point to unattractive risk-reward perceptions in certain pockets of the market, potential bargains in others, and a readiness among traders to deploy capital selectively.
The current breadth pattern—overbought and oversold expanding together—implies that investors are actively chasing gains in some areas while aggressively selling others, creating a choppy price environment. Such a backdrop can influence trading costs, volatility, and risk management practices for both institutional and retail participants. In practical terms, fund managers may reassess position sizing, hedging strategies, and liquidity buffers as they navigate a landscape where price movement is not uniformly supportive of risk-on sentiment.
Regional and sectoral implications: where breadth is most pronounced While the S&P 500 represents a broad national cross-section, regional and sectoral dynamics often reflect divergent macro Exposure and cycle timing. Historically, technology and communication services stocks have driven early-stage breadth expansions during periods of favorable growth expectations, while industrials, materials, and energy tend to respond to trade policy signals, commodity cycles, and capital expenditure plans. The current mixed breadth signals could imply a transitional phase where technology leadership persists in certain sub-sectors, while energy and cyclicals experience more pronounced volatility as global demand signals evolve.
Investors should monitor sector-specific performance alongside the overall breadth metrics. A notable dispersion between the top-performing groups and laggards can foreshadow a rotation that tests support levels across multiple areas of the market. In regional terms, technology hubs and coastal markets often reflect sensitivity to interest rate expectations and funding environments, while inland and manufacturing-oriented regions may respond more to tangible activity indicators and supply chain normalization.
Regional comparisons: stability versus volatility benchmarks Comparisons with international peers and domestic regional benchmarks can provide additional context for interpreting the current breadth anomaly. In periods of U.S. equity breadth widening while prices are elevated, investors frequently examine cross-market correlations, currency fluctuations, and global growth trajectories to gauge contagion risk. Regions that historically exhibit lower valuation dispersion may experience more pronounced pullbacks if the breadth impulse is driven by overcrowded trades or momentum crowdedness. Conversely, markets with more disparate stock-level valuations could offer selective opportunities as oversold pockets emerge in locally sensitive sectors.
From a Santa Clara vantage point, Silicon Valley’s innovation ecosystem often injects a unique mix of growth-oriented exposure into index dynamics. Local investor behavior tends to reflect a blend of venture-backed optimism and scalpel-precise risk management, which can amplify selective breadth movements in technology-adjacent names. Yet a broader, nationwide breadth shift can still ripple through regional portfolios, influencing hedging requirements, funding cycles for startups, and the pricing of growth equity in nearby corridors.
Historical performance patterns following similar breadth extremes Past episodes where overbought and oversold readings both rose meaningfully within the same month have often preceded periods of elevated volatility rather than clear directional thrust. In many cases, these moments resolved through pullbacks in overextended names or broader rotations that restored balance across sectors. However, the timing and magnitude of subsequent moves have varied, contingent on macro developments, earnings surprises, and policy signals. For investors, the key takeaway is to prepare for a window of heightened trading activity and to ensure risk controls align with a more uncertain price path.
What this means for risk management and portfolio construction In light of the current breadth configuration, risk managers may consider several prudent adjustments. First, reassessing stop-loss placements and position-sizing discipline can help mitigate drawdown risk in sectors experiencing sharp, idiosyncratic volatility. Second, implementing hedging strategies—such as options wings or volatility-sensitive exposures—can provide a ballast during rapid price swings. Third, maintaining liquidity reserves or flexibly allocating to high-quality, defensively oriented assets can reduce downside exposure when market breadth becomes unsettled.
Longer-term investors might view today’s dynamics through the lens of structural resilience. A broad market environment that accommodates both upside momentum and selective downside protection can support a policy of gradual, disciplined compounding rather than rapid, speculative bets. For sectors with durable earnings fundamentals and established competitive moats, stock pickers may find opportunities to accumulate exposure on oversold readings, while avoiding crowded trades in those demonstrating stretched valuations.
Public sentiment and market psychology: response to divergence Public reaction to mixed breadth signals often features a blend of optimism and caution. When a large share of stocks shows overbought characteristics, some investors interpret it as a sign of strong momentum and confidence in future earnings. Others worry about a potential pullback if valuations become unsustainable. Concurrent oversold readings can spark renewed interest in bargains, as contrarian traders seek out mispriced names with improving catalysts. In Santa Clara and similar innovation clusters, sentiment can swing quickly as company-specific news—such as earnings, product launches, or regulatory updates—reframes the risk-reward calculus for adjacent equities.
Policy environment: the backdrop shaping risk appetite The macro policy environment remains a critical determinant of how breadth signals translate into actual price action. Interest rates, inflation trajectories, and fiscal momentum all influence the cost of capital and the discount rates applied to future cash flows. As investors weigh the balance between growth potential and capital preservation, breadth signals provide a microscope on how market participants price risk in real time. While the present divergence does not by itself prescribe a specific trajectory, it underscores the importance of aligning investment strategies with evolving macro assumptions and sector fundamentals.
Conclusion: navigating a complex breadth landscape The simultaneous rise in both overbought and oversold stocks within the S&P 500 marks a rare moment in market dynamics. It highlights a market that is actively trading across a wide spectrum of outcomes, with some components advancing on momentum while others retreat on risk considerations. For investors, the prudent course is to emphasize disciplined risk management, selective stock picking, and an awareness of regional and sectoral nuances that can drive spillover effects across portfolios. As the market digests this unusual breadth signal, market participants will watch closely for confirmation signals—whether in earnings reactions, macro data prints, or policy developments—that can illuminate the path forward. This moment serves as a reminder that breadth measures, while not predictive on their own, offer valuable context about the health and direction of the broader market.
Note: The analysis reflects the latest breadth readings and historical context relevant to S&P 500 components and does not constitute investment advice. Readers are encouraged to consult with a financial professional for personalized guidance.