Large-Cap Momentum Reversal Pushes Equal-Weighted S&P 500 to 25-Year High in Relative Strength
Large-Cap Leadership Breaks as Momentum Gauge Hits Dot-Com Era Lows
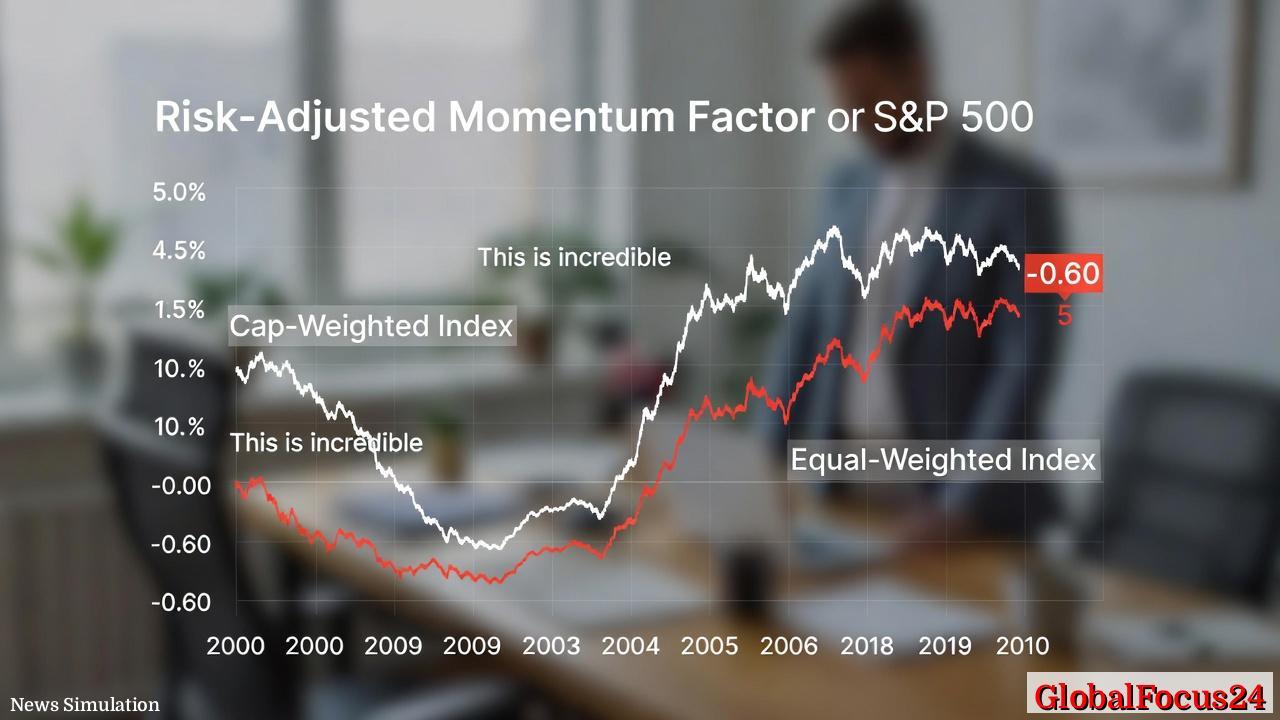
A key market signal tracking the performance gap between the largest U.S. stocks and the average S&P 500 constituent has fallen to its weakest level in a quarter century, underscoring a sharp shift in equity market leadership. The 3‑month risk-adjusted momentum factor between the S&P 500 cap‑weighted and equal‑weighted indices has dropped to ‑0.60, its lowest reading since the aftermath of the Dot‑Com Bubble burst in 2000.
In practical terms, this move indicates that large‑cap stocks, which dominate the traditional S&P 500 index, have delivered the weakest volatility‑adjusted returns relative to the average stock in 25 years. The reading marks a dramatic reversal from November, when the same indicator registered +0.60 in favor of large caps and signaled strong momentum at the top end of the market.
As leadership has rotated, the S&P 500 equal‑weighted index is now outperforming the standard market‑cap‑weighted S&P 500 by about 5 percentage points, the widest margin in at least 36 years, according to recent market commentary and long-run index data. Mega‑cap technology stocks, which powered much of the market’s gains over the past decade, have shifted from market leaders to notable laggards in this environment.
Understanding the Risk-Adjusted Momentum Factor
The 3‑month risk‑adjusted momentum factor compares recent performance between the cap‑weighted and equal‑weighted versions of the S&P 500 while accounting for volatility. A positive reading implies that large‑cap stocks are outperforming on a volatility‑adjusted basis; a negative reading signals that the average stock is delivering better risk‑adjusted returns than the biggest names. Analysts often view extreme readings as markers of stress or inflection in market leadership.
The current ‑0.60 level suggests not only that large caps are lagging, but that they are doing so even after adjusting for risk, implying that investors are not being compensated with superior returns for holding the larger, more widely owned names in the index. The speed of the shift is also notable: the move from +0.60 in November to ‑0.60 today represents a full 1.20‑point swing in just a few months, highlighting a rapid unwind of prior large‑cap momentum.
Because the cap‑weighted S&P 500 is heavily concentrated in a handful of mega‑cap technology and growth companies, the momentum factor is also an indirect barometer of sentiment toward those firms. When the factor turns sharply negative, it typically reflects investors rotating into smaller components of the index, more cyclical sectors, or value‑oriented names that carry less weight in the cap‑weighted benchmark.
Historical Parallels with the Dot-Com Bust
The last time the momentum factor was this weak for large caps relative to equal‑weighted constituents was in the early 2000s, in the wake of the Dot‑Com Bubble’s collapse. At that time, extreme concentration in technology and growth stocks gave way to a prolonged period in which more diversified or value‑tilted strategies, including equal‑weighted indices, outperformed.
Current conditions echo that earlier episode in several ways. Then, as now, a small cluster of large technology and internet names had driven index gains and elevated market concentration to historically high levels. When sentiment shifted and valuations compressed, returns broadened out to a wider set of companies, and equal‑weighted measures of the market fared better than cap‑weighted benchmarks.
Data from that period show that after a comparable reversal in performance, the equal‑weighted S&P 500 went on to outperform the cap‑weighted version by roughly 18 percentage points over the following year. While past patterns do not guarantee future outcomes, the historic precedent underscores how dramatically leadership can reverse when concentration breaks and investors reassess the premium paid for the largest and most popular stocks.
Equal-Weighted Index Extends Rare Outperformance Run
The current 5‑percentage‑point edge for the S&P 500 equal‑weighted index over the cap‑weighted benchmark marks one of the most significant short‑term divergences in modern index history. In equal‑weight construction, each of the 500 constituents receives the same weight, regardless of market capitalization, which naturally increases exposure to mid‑ and smaller‑large‑cap names and reduces dependence on a narrow group of mega‑caps.
In recent years, the cap‑weighted S&P 500 often outpaced its equal‑weighted counterpart, thanks largely to the outsized gains of mega‑cap technology and communication services stocks. Analysts have noted that over the past decade, strong performance of these large names and the outperformance of momentum‑driven strategies generally tilted returns in favor of cap‑weighted indices, while equal‑weight indexes lagged during periods of narrow, growth‑led rallies.
Over longer horizons, however, studies by index providers suggest that equal‑weighted versions of broad benchmarks have historically produced modestly higher average returns, particularly following peaks in market concentration. Those phases tend to coincide with environments in which leadership broadens, sector performance rotates more frequently, and investors reallocate away from the most crowded names into a broader set of opportunities.
Mega-Cap Technology Stocks Lose Their Grip
One of the defining characteristics of the current shift is the fading dominance of mega‑cap technology stocks. After years of leading the S&P 500 and accounting for a large share of its gains, many of these firms have recently underperformed the average stock in the index on a risk‑adjusted basis. That pattern is central to the sharp decline in the momentum factor and the widening performance gap between equal‑weighted and cap‑weighted indices.
Market research over the past several years has highlighted how a handful of very large companies can increasingly drive index performance when they outperform, leading to elevated concentration and higher sensitivity of investor portfolios to the fate of those names. When that leadership reverses, the same concentration becomes a vulnerability, exposing cap‑weighted indices to underperformance relative to more diversified constructions.
Recent commentary also points out that the cap‑weighted S&P 500 has, at times, exhibited higher short‑term volatility than the equal‑weighted index, an unusual pattern given the traditional perception of large caps as more stable. When volatility rises at the top of the index without a commensurate return benefit, risk‑adjusted metrics can deteriorate quickly, further tilting performance toward equal‑weight approaches.
Economic and Market Implications of the Shift
The rotation away from mega‑caps toward the broader market carries several potential economic and financial implications. First, it suggests that investors may be reassessing growth expectations, valuations, or policy risks around the largest technology and growth companies, while finding relatively better value or prospects in more cyclical or domestically focused sectors. Such shifts often align with changing views on interest rates, inflation, and the durability of earnings growth across different parts of the economy.
Second, broader market participation can alter how equity performance feeds into household wealth and business financing conditions. When gains are concentrated in a small number of stocks, the benefits tend to be more narrowly distributed among investors and sectors; when performance broadens, a wider range of industries, from industrials to financials and consumer companies, may see improved equity valuations and potentially lower capital costs. This can influence hiring, investment, and merger and acquisition activity in those areas.
Third, the shift may affect portfolio construction for institutions and individuals. Many investors benchmark against or invest through cap‑weighted indices; sustained underperformance of those benchmarks relative to equal‑weight alternatives can prompt reassessment of index selection, diversification strategies, and risk controls. A prolonged period of equal‑weight outperformance could spur increased adoption of strategies that reduce concentration risk and distribute exposure more evenly across constituents.
Regional and Global Context for Breadth Shifts
The broadening of U.S. equity market performance has parallels in other regions and past cycles. In several historical episodes, including the early 2000s and mid‑2000s, phases of extreme concentration in U.S. growth and technology stocks were followed by periods in which non‑U.S. markets, value stocks, or smaller companies outperformed, as capital rotated in search of diversification and more attractive valuations.
Recent analysis of equal‑weight versus cap‑weight performance has also examined market behavior across different geographies, noting that concentration trends and leadership cycles are not unique to the United States. For example, European and Asian benchmarks have at times seen similar dominance by a limited number of large constituents, followed by reversals when macroeconomic conditions, currency moves, or sector‑specific developments favored broader participation.
Within the U.S. market, earlier periods of improved breadth—such as in 2003–2007, 2016–2017, and parts of 2021—have often corresponded with phases of global economic recovery, reflation, or reopening, during which cyclical sectors and a wider range of companies contributed to index gains. While each cycle has its own drivers, a common thread is that equal‑weighted or diversified strategies tend to fare relatively better when markets move away from narrowly focused, momentum‑driven leadership structures.
Investor Sentiment and Market Breadth
The current performance of the equal‑weighted S&P 500 is being closely watched as a gauge of market breadth and investor sentiment. Market breadth measures, which track how many stocks are rising versus falling, often improve when equal‑weight indices outperform, signaling that rallies are being supported by a larger share of constituents rather than a few dominant names.
Recent social and professional commentary has emphasized that the backdrop is unusual, as many of the strongest periods of equal‑weight outperformance in recent years have occurred during market stress rather than in broadly rising environments. The present episode, by contrast, is being interpreted by some analysts as a potentially healthier pattern for the market, one in which gains—where they occur—are more evenly distributed, even as prior leaders struggle to maintain their previous pace.
At the same time, the abruptness of the leadership change and the historically extreme momentum reading inject a sense of urgency into the discussion about concentration risk, index construction, and the sustainability of recent trends. The decline in the risk‑adjusted momentum factor to levels last seen around the Dot‑Com bust serves as a reminder that extended periods of narrow leadership can end suddenly, leaving heavily concentrated positions exposed when sentiment turns.
Looking Ahead: Key Signals to Watch
Going forward, investors and analysts are likely to monitor several indicators to assess whether the current rotation continues or reverses. Among them are:
- The trajectory of the 3‑month risk‑adjusted momentum factor between cap‑weighted and equal‑weighted versions of the S&P 500, which will show whether large caps regain risk‑adjusted leadership or remain under pressure.
- Measures of market concentration, such as the combined weight of the largest constituents in the S&P 500, which tend to decline when equal‑weight strategies outperform.
- Relative performance of mega‑cap technology stocks versus the broader index, as a proxy for whether the recent shift away from prior leaders is structural or temporary.
- Cross‑regional and cross‑asset trends, including whether similar broadening appears in non‑U.S. equities and in sectors tied closely to global growth and interest‑rate expectations.
While it remains unclear how long the current pattern will persist, the magnitude of the recent move and its historical parallels are prompting renewed focus on diversification, risk‑adjusted returns, and the hidden vulnerabilities of concentrated benchmarks. The rotation from mega‑cap market leadership toward the average stock, reflected in the most negative momentum reading in a generation, marks a notable turning point in the structure and psychology of U.S. equity markets.