U.S. Household Debt Climbs to $18.8 Trillion in Q4 2025, Reflecting Steady Post-Pandemic Strains and Broad Economic Shifts
The total U.S. household debt level rose to $18.8 trillion in the fourth quarter of 2025, marking a 1.0% increase from the prior quarter and a cumulative $740 billion rise for the year. This trajectory continues a multi-year pattern of rising balances that traces back to the end of the 2019 period, underscoring the enduring pressure of housing costs, consumer credit, and elevated financing needs across households in the United States. The latest data, released by a major Federal Reserve supervisory report, offer a snapshot of how families are juggling mortgages, everyday expenses, and a shifting credit landscape in a still uneven economic environment.
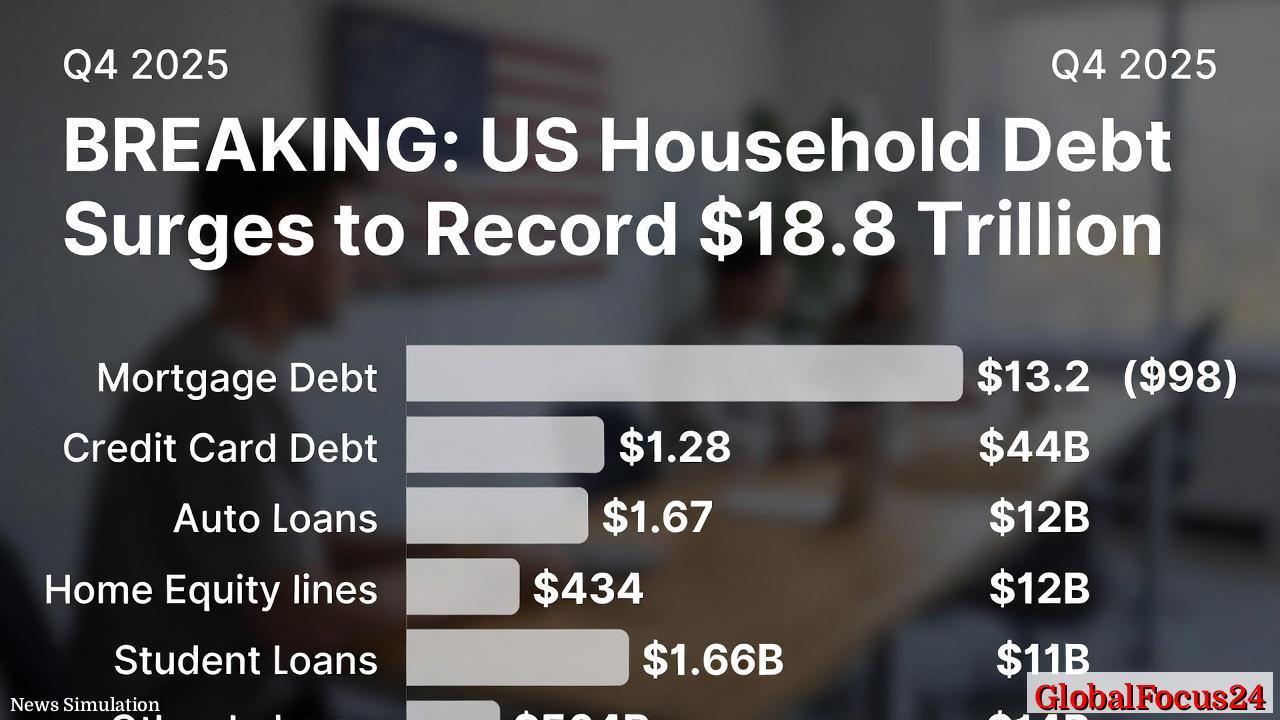
Historical context: debt growth as a late-cycle phenomenon Debt growth has long mirrored macroeconomic cycles, but the post-pandemic period has produced a distinctive blend of higher interest rates, inflationary pressures, and wage dynamics that shape collective household behavior. Mortgage balances—already the largest share of total household indebtedness—rose by $98 billion in Q4 2025, reaching $13.17 trillion. The persistence of elevated home values in many markets, coupled with refinancing activity and sticky mortgage payments for a substantial portion of homeowners, has sustained the housing-related component as the dominant pillar of household leverage.
Meanwhile, non-housing balances gained momentum, increasing by $81 billion to push non-housing debt higher by 1.6% from the third quarter. This category includes credit card debt, auto loans, student loans, home equity lines of credit (HELOCs), and other balance types. The combined rise in non-housing balances signals that consumer financing and durable goods purchases continue to play a significant role in household budgets, even as borrowers navigate higher borrowing costs.
Economic impact: spread and implications across sectors The increase in total debt and the compositional shifts within it carry multiple implications for the broader economy. A higher debt stock can stimulate consumption and housing activity when financing costs are manageable, contributing to short-term growth through purchases of cars, furniture, electronics, and home improvements. However, elevated debt levels also raise sensitivity to interest rate changes. As rates move or remain higher, debt service obligations can strain household cash flows, potentially dampening discretionary spending and influencing saving behavior.
Mortgage debt remains the most influential driver of the debt landscape. Even modest changes in mortgage rates or housing affordability can affect not only new borrowing but also the housing market’s velocity, including home sales, construction activity, and home renovation spending. The Q4 increase in mortgage balances suggests continued borrowing activity within the housing sector, which can have cascading effects on home-related industries, from real estate services to construction to mortgage lending.
Credit card balances rose by $44 billion, a sign of ongoing consumer reliance on revolving credit to cover everyday expenditures and occasional liquidity gaps. This component often serves as a barometer of consumer finances, where rising balances alongside higher interest rates can translate into greater financial strain if incomes do not keep pace. Auto loan balances increased by $12 billion, reflecting sustained demand for vehicles, improved consumer confidence in longer-term financing, and competitive financing offerings in the automotive sector.
Student loan balances grew by $11 billion, reflecting ongoing financing needs in higher education and the broader complex landscape of public policy and repayment obligations. HELOC balances climbed by $12 billion, signaling continued home equity utilization as households seek liquidity tied to real estate wealth for major expenses or debt consolidation. The “other” category, which captures a mix of smaller or specialty credit instruments, rose by $14 billion, completing the picture of broad-based borrowing across multiple channels.
Regional comparisons: varying debt dynamics across markets Different regions exhibit distinct debt dynamics shaped by housing markets, wage growth, cost of living, and credit access. In many coastal and tech-driven metros, persistent housing affordability challenges have kept mortgage debt high relative to income, while still enabling housing markets to sustain activity through refinancings and new purchases when rates permit. In inland and southern regions, stronger job growth in certain sectors has supported auto lending and consumer finance, though rising interest costs have tempered some expansions. The contrast between regions highlights how local economic conditions, not just national aggregates, determine the pace and composition of household borrowing.
Delinquency trends: signs of stress and resilience Aggregate delinquency rates rose to 4.8% of outstanding debt, signaling a modest uptick in late payments across categories. Delinquency movements can reflect a mix of serviceability pressures, delayed payments during transitional periods, and evolving credit access rules. While 4.8% indicates a generally healthy credit environment relative to historical peaks, it also serves as a reminder that any sustained deterioration in employment or incomes can quickly affect repayment behavior across households.
What this means for policymakers and the public
- Financial resilience: As debt levels persist at elevated baselines, households may prioritize essential expenses and debt-service obligations, with potential spillovers into savings rates and investment in long-term assets.
- Monetary policy transmission: The debt stock interacts with interest rate policy by shaping borrowers’ responses to rate changes, particularly in mortgage finance, auto lending, and credit card utilization.
- Housing affordability and supply: Mortgage dynamics will continue to be a focal point for housing affordability discussions, with implications for home-building activity, rental markets, and neighborhood demographics.
- Credit access and consumer finance: The balance between affordable credit and prudent lending remains a central concern, especially for subprime or near-prime borrowers who may be more vulnerable to rate shifts and economic shocks.
Key takeaways for readers
- The fourth-quarter 2025 data show a continuing trend of rising household indebtedness, underpinned by mortgages while non-housing debts expand in tandem.
- Delinquency rates, though elevated from the previous period, do not yet indicate a systemic crisis, but they warrant close monitoring as interest rates and economic conditions evolve.
- Regional variations matter: some markets show resilience and growth in certain debt segments, while others face stronger affordability constraints that shape borrowing patterns.
Contextual comparison: debt trajectories in peer economies Across advanced economies, households carry varying levels of debt and exposure to rate changes. The United States has one of the most developed consumer credit ecosystems, with a wide array of financing options that can cushion or amplify economic fluctuations. By comparison, some peers with stricter lending standards or different housing finance frameworks may experience slower debt growth but also different vulnerability profiles. Observing how debt composition evolves in these contexts illuminates the balance between growth, risk, and financial stability on a regional scale.
A closer look at the composition
- Mortgages: The mortgage segment remains the dominant share of total debt, reflecting the long-standing central role of homeownership in household balance sheets and wealth-building narratives.
- Student loans: Student loan balances illustrate ongoing exposure to educational financing, which intersects with policies, repayment schemes, and labor-market outcomes for graduates.
- Credit cards: Revolving credit remains a flexible but potentially costly source of funds for households, influenced by interest rate environments and consumer confidence.
- Auto loans: Auto financing signals demand for durable goods and mobility, with implications for manufacturing, automotive markets, and consumer liquidity.
- HELOCs and other: Home equity lines of credit provide liquidity tied to real estate equity, while other debt categories capture a range of smaller or specialty credit facilities.
Illustrative example: a typical household profile in late 2025 Consider a consumer household balancing a mortgage, a car loan, and a credit card, with occasional HELOC usage for major repairs. If mortgage rates are moderately elevated, monthly housing costs may consume a larger share of income, while continued auto loan and credit card activity sustains consumer spending in other areas. This household might experience higher debt service relative to a few years prior, but still maintains access to credit channels that support essential purchases and investment in the home.
Forward-looking outlook Predicting exact trajectories remains challenging, given potential shifts in interest rates, employment conditions, and inflation. If monetary policy continues to tighten or remains restrictive, households could face higher debt service burdens, potentially impacting consumption more broadly. Conversely, a stabilizing or easing rate environment could bolster refinancing activity, reduce monthly payments, and support continued borrowing for major purchases and renovations. The ongoing balance between debt growth and income growth will shape consumer confidence and macroeconomic momentum in 2026 and beyond.
Final note: a snapshot of a dynamic financial landscape The Q4 2025 debt figures capture a moment in a multi-year evolution of household finance in the United States. They reflect how families adapt to changing cost of living, shifting credit conditions, and the perennial drive to secure housing, education, transportation, and everyday goods. As markets monitor the implications of these trends, the data serve as a barometer for financial stability, household budgeting choices, and the broader health of the economy.